Table 2
Completion requirements

For an example of the use of the Checklist in making a non-detriment finding, see: Development of a Non-Detriment Finding Process for Pelargonium Sidoides in Lesotho, p.14.
Table 2
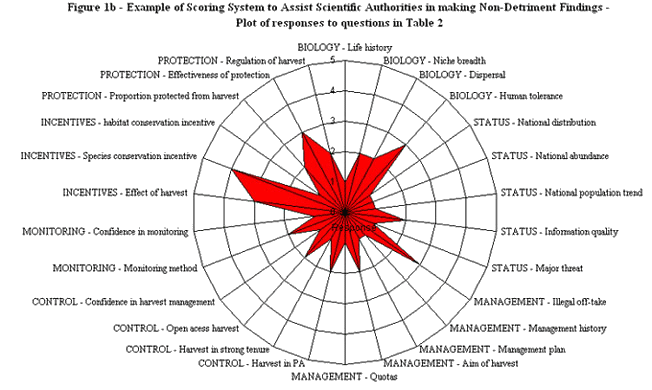
Table 2 results can be visualized as a circular chart, to help evaluate where biological and management information are strongest or weakest, so as to help decision-makers reach a conclusion.
The greater amount of red emanating from the center indicates where knowledge gaps occur or risk may be greater (outer ring = least information, riskiest).

You will have an opportunity to use and vizualize table 2 of the Checklist in the Chapter: Final Application
Last modified: Friday, 14 March 2014, 10:16 AM
