b. Transfer the results from Table 2 to an Excel format spreadsheet to visualize the results
Visualize results
b. Transfer the results from Table 2 to an Excel format spreadsheet to visualize the results

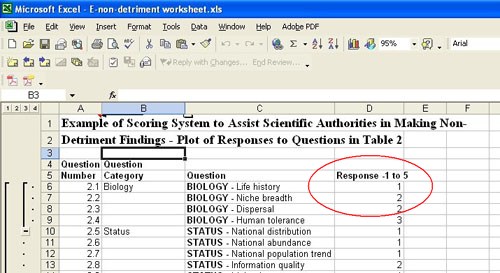
Scoring on Table 2 uses a scale from one to five and is included in the fourth column (from the left), entitled: Response 1 to 5. Note that 1 indicates a high level of knowledge and 5 indicates a low level of knowledge.
Each answer in Table 2 gives you a numerical score that you can use to create a circular graph to graphically show the results and help you with your evaluation.
Click here or on the spreadsheet image to begin entering/changing data on Table II (Excel format) in the Responses 1 to 5 column.
Table 2 in Excel format will look like this:
When you complete entering data, click on the tab at the bottom left of the Excel spreadsheet to visualize data: